Lowcountry Heat Challenge
The Lowcountry is Getting Hotter
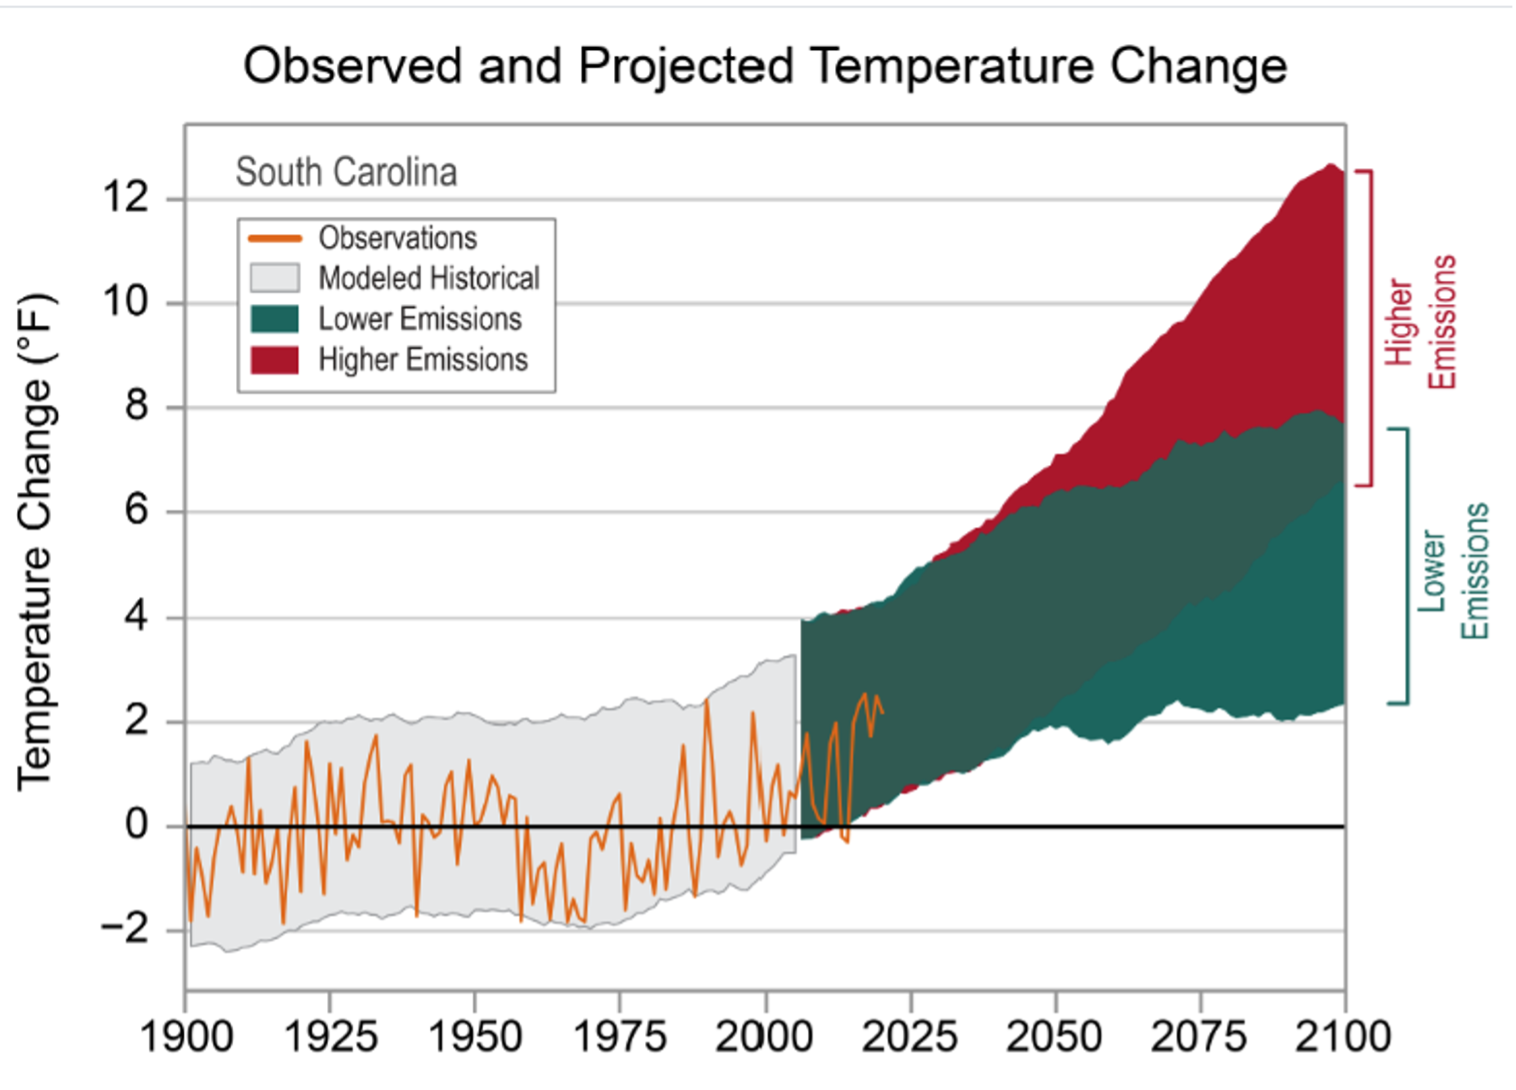
There has been an increase in annual average temperatures across South Carolina since the 1960s, which is mostly explained by a substantial rise in minimum temperatures.[9] The rise in minimum temperatures is concerning because warm nights do not allow the body to recover following a heat-stressed day.
The number of days of extreme heat has also increased in the Lowcountry. Charleston recorded maximum temperatures of at least 90°F for 80 days or more (almost three months during the summer) in 2010, 2011, 2014, 2016, 2018, 2019, and 2024. Prior to this recent history, only three years reached this level (1980, 1986, and 1990) since record keeping began in 1893.[10]
Recent Extreme Heat Levels
The Lowcountry’s temperatures ramp up in the summer months with a peak in July, although in recent years unseasonably warm temperatures in the Spring warranted an early heat alert. While the 1991-2020 average maximum temperature in July for Charleston Airport was 91.3°F, fortunately, the Lowcountry’s summertime climate is somewhat moderated by cooling sea-breezes. Comparatively, without those breezes, further inland, Columbia Airport’s average maximum temperature in July is 93.2°F. But temperature isn’t the only factor. The ocean also increases humidity in the Lowcountry, and the heat index can be extreme. For example, from 1991-2020 the average number of hours of heat index above 105°F was 34.8 for Charleston compared to 15.6 for Columbia, and the unofficial state record heat index of 124°F was set in Mount Pleasant, Charleston County in 2011.[11]
Future Extreme Heat Levels
In the coming decades, maximum and minimum summertime temperatures are projected to increase. The maximum July temperature for Charleston Airport is expected to reach between 92.8°F and 93.6°F on average during 2036-2065 depending on how much carbon dioxide is emitted globally. This is 1.5 – 2.3°F above the current 30-year average of 91.3°F. In any event, the number of days exceeding 90°F would rise and heat waves would be a more common occurrence. Less certain than the increase in temperature is the change in relative humidity and winds. Relative humidity will likely stay the same and the sea breeze may become stronger in the future. Finally, if more of the Lowcountry is urbanized in the 21st century, we can expect higher heat stress due to the urban heat island effect and radiation, which has a big impact on overnight temperatures (Figure 6).
To learn more: NOAA National Centers for Environmental Information/State Climate Summaries
Water AND Heat
Recognizing that the Lowcountry has always had a problem with water and flooding, which is worsening with climate change, our region has several stormwater and tidal flooding programs and projects underway. In addition to this important work, it is essential that the region’s heat challenge is not lost in its simultaneous water challenge.[13] Water AND Heat are crucial issues in the Lowcountry. While temperature is the obvious starting point, it is not a complete descriptor of heat risk, especially for the Southeast U.S.
Common Terms
To better understand the Lowcountry’s Heat Challenge, common terms and issues include Heat Index (including Heat Advisory, Extreme Heat Watch, and Extreme Heat Warning), Urban Heat Island, Heat Risk and Wet Bulb Globe Temperature. Pertinent to our region, it is also important to understand Lowcountry climatology trends (from NOAA) and complications from humidity.
Heat Index
In 1979 the National Weather Service (NWS) began using the term ‘heat index’, which used biometeorology research (combining biology and meteorology to understand how climate impacts us and other living things) to develop an “apparent temperature” based on temperature and humidity. For example, a temperature of 90°F and a relative humidity of 70% would produce an apparent temperature of 105°F. Heat index is commonly used to communicate how heat “feels”. This is familiar language in daily weather reports (e.g. the air temperature is 90° with a ‘feels like’ temperature of 102°).
There are three main ways a person can lose heat (cool off):1) radiation (we emit heat when the air around us is cooler than we are); 2) wind (breezes help cool us by accelerating radiation and evaporating our sweat); and 3) evaporation (we sweat). The effectiveness of evaporation is highly dependent upon humidity. When humidity is high, it is much harder for sweat to evaporate.
When the heat index exceeds a specified threshold, the NWS will issue Watches, Warnings, or Advisories (WWA). The Charleston NWS office recently re-evaluated their WWA criteria to better align with local impacts. Heat-related Emergency Medical Service (EMS) call data from 2020-2022 was obtained from the South Carolina Department of Public Health and the Georgia Department of Public Health. Days with the highest number of heat-related calls were compared to meteorological observations, specifically the daily maximum temperature, minimum temperature, and maximum heat index. The EMS call data supported lowering criteria, since there were several instances where calls were high and the observed heat index was below current thresholds. Heat Advisories will now be issued for the Charleston area when heat indices are forecast to reach 108-112°F for at least 2 hours or more; Extreme Heat Watch/Warnings will be issued when heat indices are forecast to reach or exceed 113°F for at least 2 hours or more.
Note that there are three types of alerts: (1) Heat Advisory, (2) Extreme Heat Watch, and (3) Extreme Heat Warning. These thresholds and recommendations (adapted from the NWS) are:
- Heat Advisory: A heat index of 108–112°F for at least two hours
- When a Heat Advisory is issued, consider postponing or rescheduling outdoor activities, especially during the heat of the day. If you must be outside, be sure to drink plenty of water and take frequent breaks in the shade. Stay in a cool place, especially during the heat of the day and evening.
- Extreme Heat Watch: A heat index of 113°F or higher in the next 24–72 hours
- When a Heat Watch is issued, community members should prepare to adjust their plans. An Extreme Heat Watch is issued when conditions are favorable for an extreme heat event, but its occurrence and timing is still uncertain.
- Extreme Heat Warning: A heat index of 113°F or higher for at least two hours
- When a Heat Warning is issued, community members should avoid outdoor activities, especially during the heat of the day. If you must be outside, be sure to drink plenty of water and take frequent breaks in the shade. Stay indoors in an air-conditioned space as much as possible, including overnight. Check on family and neighbors.
To learn more:
- National Weather Service Heat Safety Tools
- National Weather Service Heat Index Chart
- The Lowcountry Toolkit Glossary
Urban Heat Island
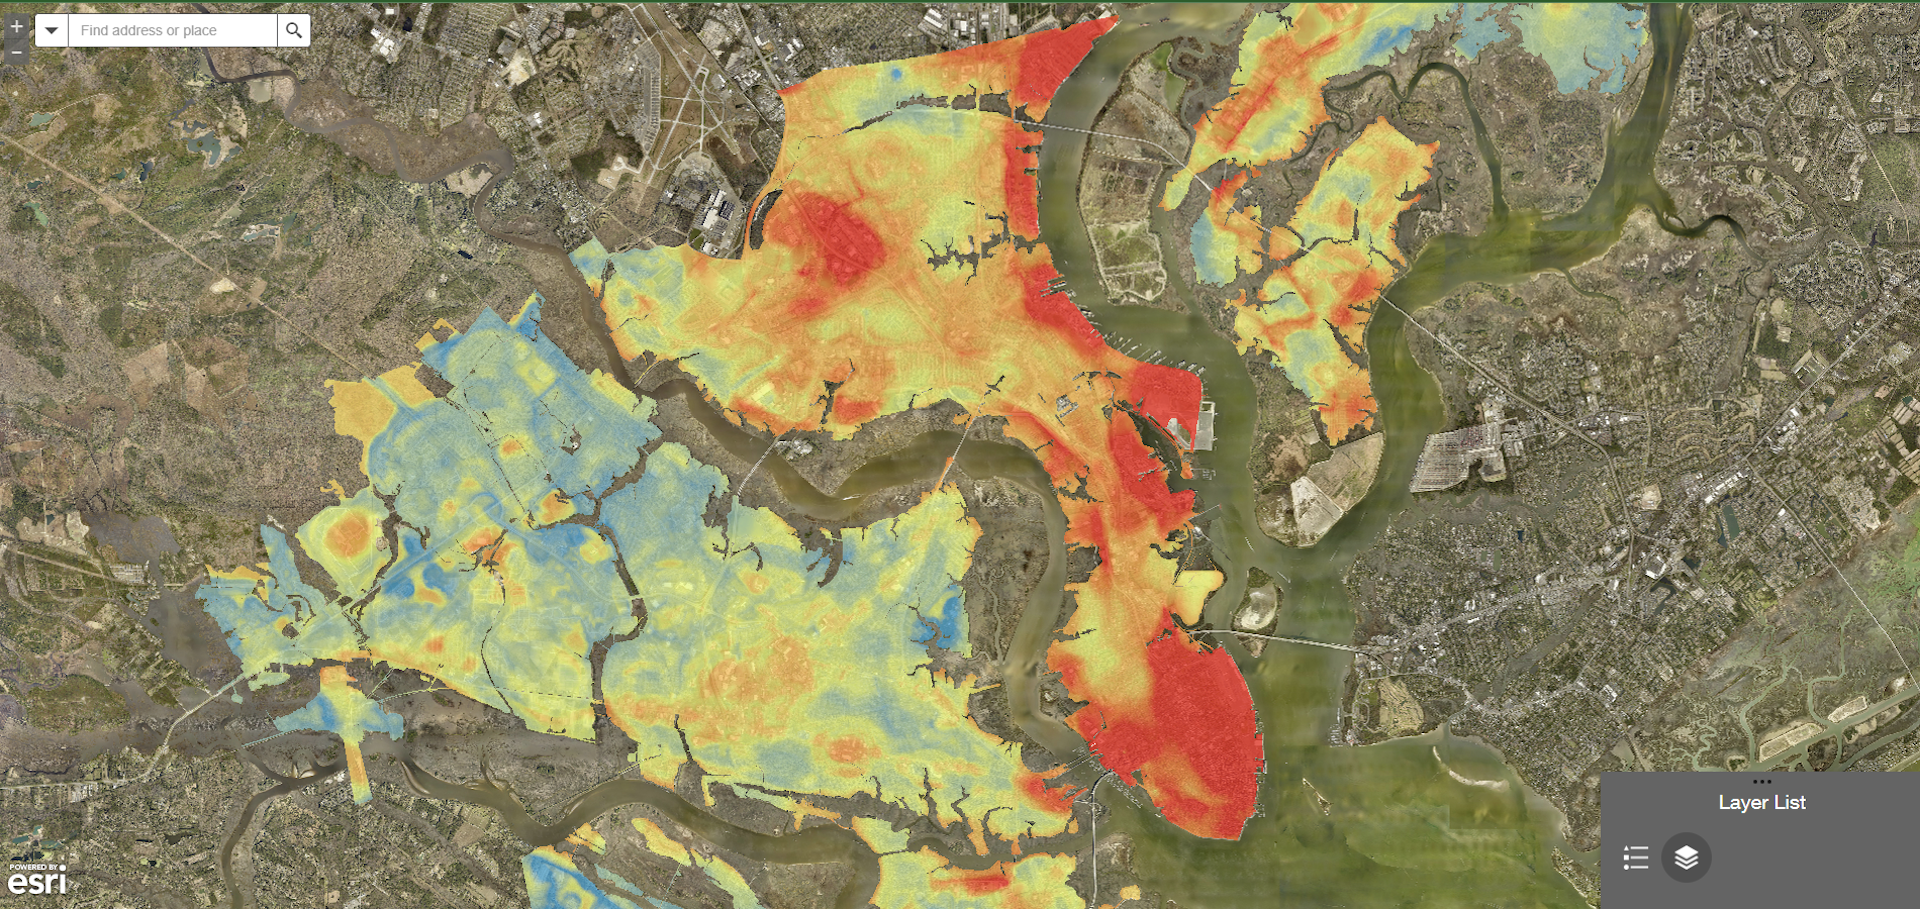
Urban areas tend to be warmer than more rural areas due to heat retaining buildings and paving, and less green spaces. This is referred to as the Urban Heat Island. For example, the City of Charleston HeatWatch campaign has recorded temperature differences of over 11° between more developed areas of the city and the more wooded areas of West Ashley.[14] This is primarily due to the density of buildings and the amount of paved surface (Figure 7).
To learn more: What are Heat Islands?
HeatRisk
NWS in partnership with the Centers for Disease Control and Prevention (CDC) recently began testing another index: HeatRisk. HeatRisk places the upcoming 7-day forecast of temperatures into context and identifies upcoming heat events that will lead to increased heat-related impacts. HeatRisk helps people understand what forecasted heat means to them and provides actionable information based on the expected HeatRisk category. The tool also provides awareness to decision makers and heat-sensitive populations who may need to take action below the traditional NWS heat product levels.
HeatRisk takes into account how unusual the heat is for the time of year (which is important as it takes time to get used to the hotter days), duration of heat (maximum daytime temperatures and minimum nighttime temperatures, which is important because the environment needs time to cool off between maximum heat periods), and whether the temperatures pose an elevated risk of heat-related impacts based on CDC data. Thus, HeatRisk is more strongly related to health outcomes than temperature alone. Taking a page from flood communication, HeatRisk is also color coded to signal the threat level from minor to extreme.
To learn more:
Wet Bulb Globe Temperature (WBGT)
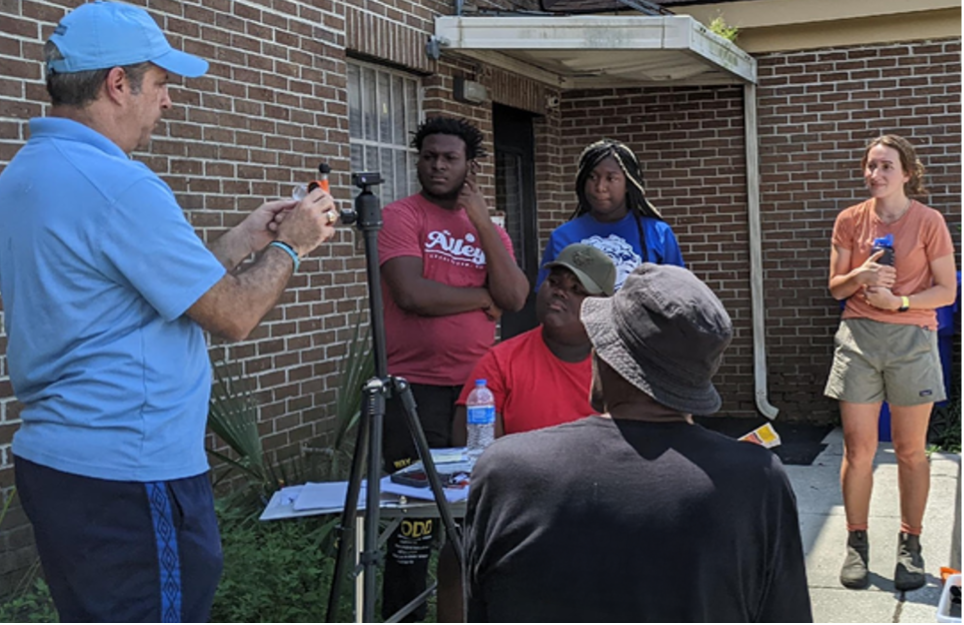
Wet bulb globe temperature (WBGT) is a complex but more complete measure of how heat affects the body. WBGT has been used by the military since the 1950s to help determine timing for outdoor training exercises and has recently been used by other agencies concerned with outside physical activity (e.g. high school athletics), outdoor workers (e.g. construction, landscapers, farmers), and indoor workers as well (e.g. factory workers in under-conditioned spaces). WBGT incorporates temperature and humidity, as well as wind speed (since wind can cause the body to lose heat) and radiation. Radiation is another way a person loses heat, but sunshine and hot objects radiate heat towards the person, increasing their heat health risk. Thus, given the same temperature, areas with high wind, shade, and low humidity are less risky in terms of heat extremes. The University of North Carolina at Chapel Hill hosts the Southeast Regional Climate Center and its work on Convergence, a readily accessible tool that explains WBGT and offers weekly forecasting across the United States. Locally, through CHHRP, The Citadel and SC Sea Grant recently completed a community science project working with community members to understand WBGT and its implications (Figure 8).
To learn more:
- National Weather Service Wet Bulb Globe Temperature
- Wet Bulb Globe Temperature Informational Guide
- Convergence Wet Bulb Globe Temperature Tool
- [9] South Carolina Department of Natural Resources (April 25, 2025) Keystone Heat Wave Events in South Carolina. https://www.dnr.sc.gov/climate/sco/Publications/SCKeystoneHeatWaveEvents.pdf
- [10] Extreme Weather Watch (April 25, 2025) Number of Days of 90°F in Charleston by Year. https://www.extremeweatherwatch.com/cities/charleston-sc/yearly-days-of-90-degrees
- [11] South Carolina Department of Natural Resources (April 25, 2025) Keystone Heat Wave Events in South Carolina. https://www.dnr.sc.gov/climate/sco/Publications/SCKeystoneHeatWaveEvents.pdf
- [12] NOAA National Centers for Environmental Information (2022) State Climate Summary South Carolina. https://statesummaries.ncics.org/chapter/sc/
- [13] Barnes and Dow (2022) Water AND Heat: Intervening in Adaptation Hazard Bias. https://www.frontiersin.org/journals/climate/articles/10.3389/fclim.2022.868017/full
- [14] NOAA (2022) City of Charleston HeatWatch Report. https://www.charleston-sc.gov/DocumentCenter/View/31232/OSF-_-Heat-Watch-Charleston_Report_120221?bidId=
- [15] NOAA (2022) HeatWatch Charleston Report. https://noaa.maps.arcgis.com/home/item.html?id=a0237ce593da4abd82ba0f070aa04a67