Extreme Heat and Health
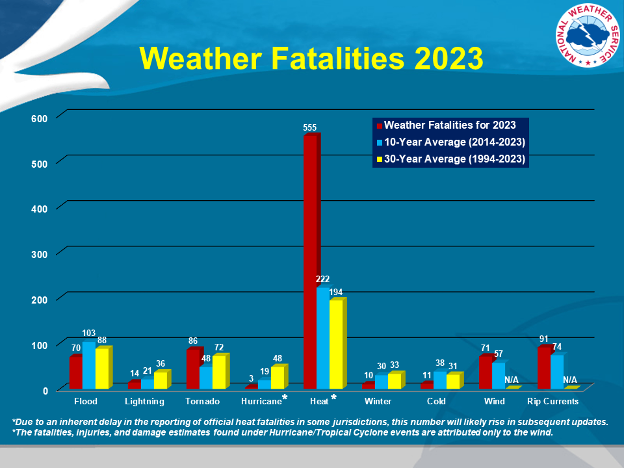
“Heat waves are, on average, the deadliest type of extreme weather. Even hot, but not extreme, summer weather can cause serious illness, death, and other harms to wellbeing. Most heat-related deaths are due to exacerbation of chronic health conditions (e.g., cardiovascular disease).”[16] Comparatively, heat-related fatalities consistently exceed other weather-related causes (Figure 9).
Heat Illness Symptoms
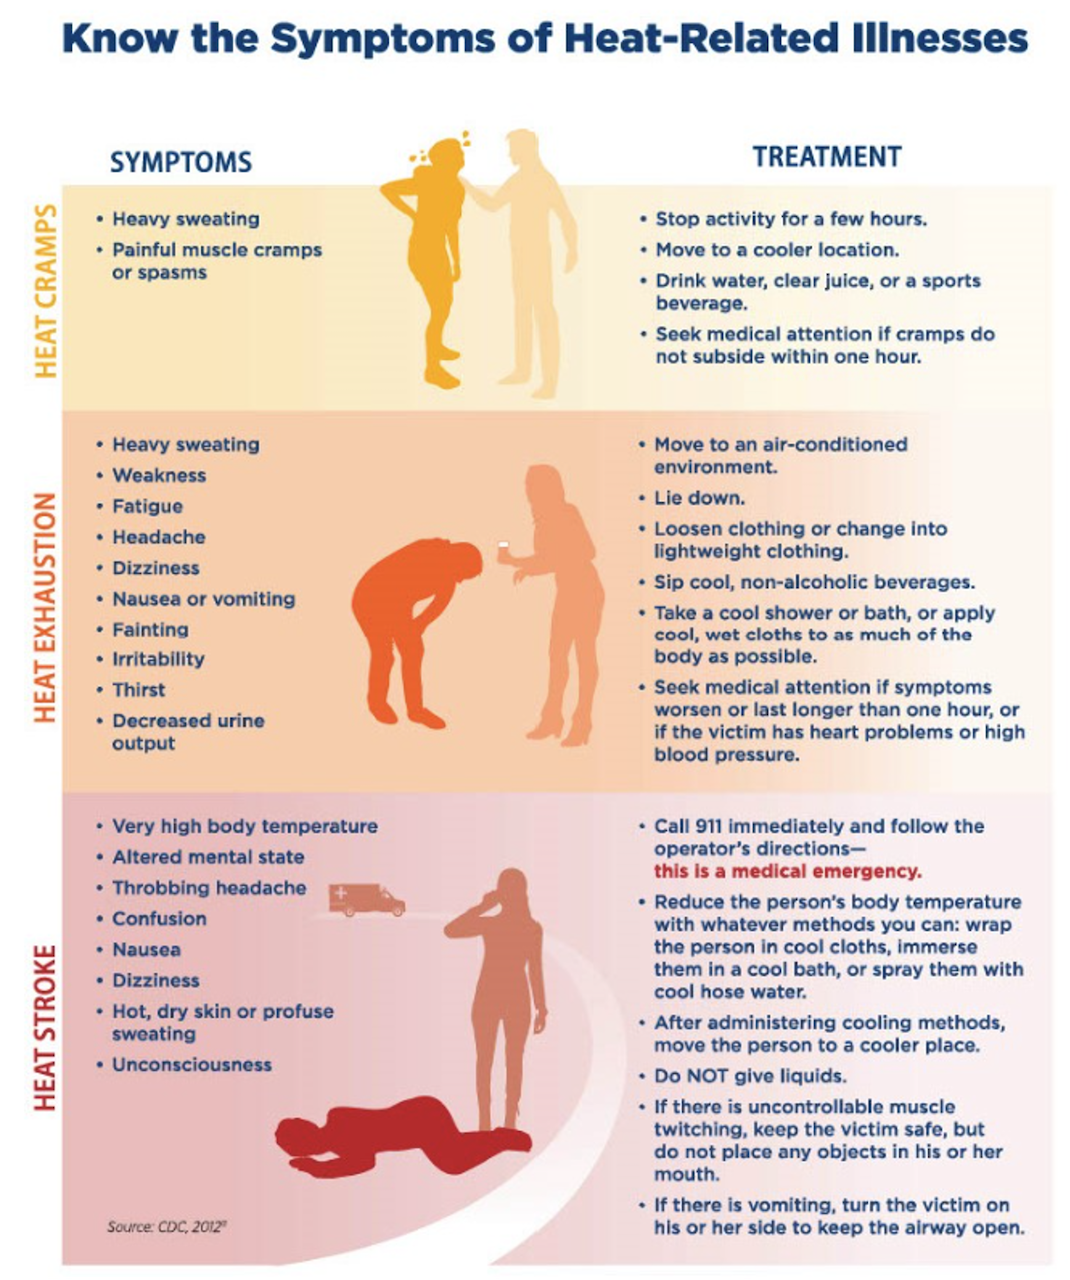
- Heat stress occurs when the body’s cooling mechanisms cannot keep up with the heat. Stress progresses in three stages, each increasing in risk (Figure 10).
- Heat Cramps may be the first sign of heat-related illness and includes painful muscle cramps and spasms alongside heavy sweating that may lead to heat exhaustion or stroke.
- Heat Exhaustion is a worsening condition that includes heavy sweating, weakness or tiredness, cool, pale, clammy skin; fast, weak pulse, muscle cramps, dizziness, nausea or vomiting, headache, and/or fainting.
- Heat Stroke is a potentially fatal condition that includes throbbing headache; confusion; nausea; dizziness; body temperature above 103°F; hot, red, dry or damp skin; rapid and strong pulse; fainting; and loss of consciousness.
The symptoms and treatment of heat cramps, heat exhaustion, and heat stroke are shown in Figure 10.
Extreme heat is associated with effects on health beyond these immediate emergencies. For example , extreme heat events have been linked to other causes of death, including from motor vehicle crashes, falls, and drowning. Visits to hospitals and emergency rooms also increase in times of extreme heat. Moreover, longer durations of extreme heat events may cause more deaths and healthcare visits. Those who are more vulnerable are at greatest risk of the effects of extreme heat including death.
Given the already recognizable increases in Lowcountry temperatures and our knowledge of heat-related health impacts, we expect to see increases in heat-related health events in the future as well as additional challenges for those with preexisting conditions that are exacerbated by heat exposure. Recognizing the high likelihood of greater health risks, the Lowcountry Heat Action Plan Toolkit offers examples of ongoing work to address those risks and resources to help households consider ways to reduce those risks.
To learn more:
- National Weather Service Heat Cramps, Exhaustion, and Stroke
- South Carolina Office of Resilience Climate Trends
- South Carolina Office of Resilience Other Hazards
- The Lowcountry Toolkit includes a glossary and other resources to reference.
Extreme Heat and Vulnerable Populations
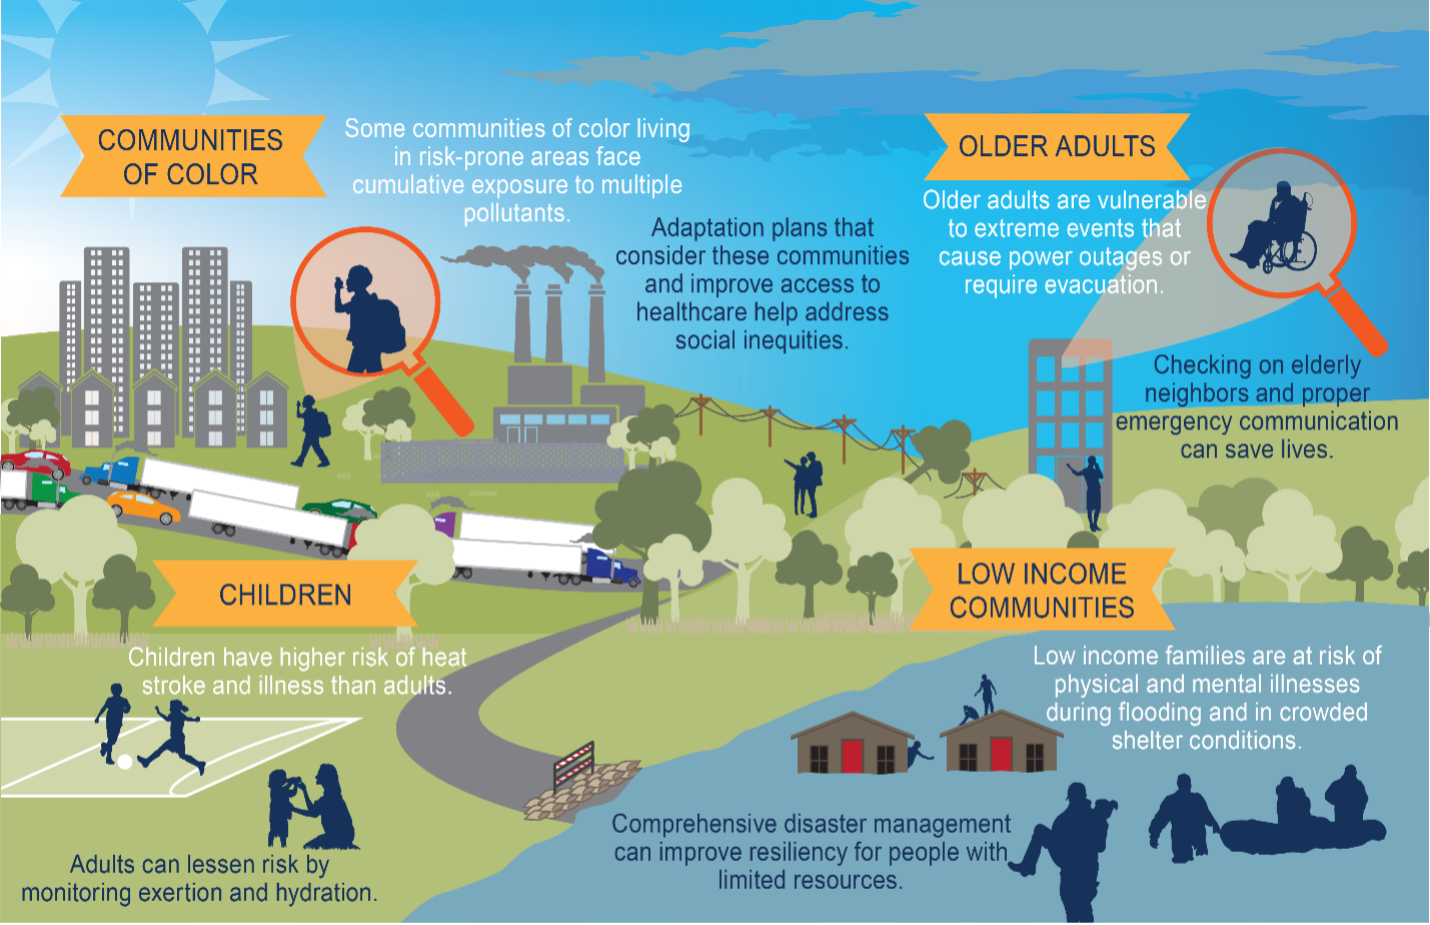
“Vulnerable people include those without air conditioning, who have one or more physical or mental health conditions, are energy insecure, are very young and older adults, or have jobs exposing them to unsafe indoor or outdoor temperatures.”[19] The National Climate Assessment summarizes these impacts (Figure 11).
The risk of adverse outcomes associated with heat is the highest for urban populations among regions that are sensitive to heat.[21] Other populations at risk of adverse heat-related outcomes include the poor (who may lack funds to seek health services or to pay for AC or to weatherize homes), young children (less than 1 year old, and less than 4 years old) and the elderly (greater than age 65 years) as both have greater difficulty regulating body temperature, those taking certain medications (which may be less effective or interact differently with heat exposure) or those who are confined to bed (and unable to seek heat relief).[22][23]Moreover, in pregnant women, extreme heat is related to preterm birth.[24] As in many other areas of health, there may be differences in health effects of heat by race. One study found that non-Hispanic Black women were more likely to experience preterm birth than non-Hispanic White women exposed to the same temperature. [25] Heat stress can affect those with respiratory disease, cardiovascular disease, and older adults more.
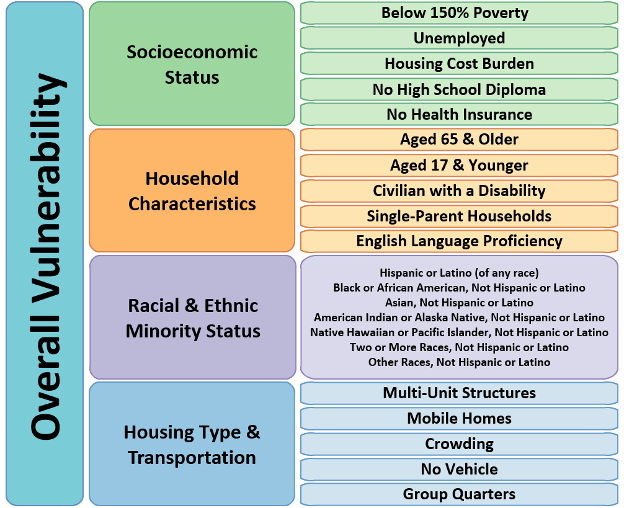
Heat stress exposure has been found to be higher in warmer neighborhoods where more persons with lower median incomes, lower educational levels, higher poverty rates, and of minority groups resided, and where resources and social support were lacking.[26] Those working in certain occupations are also vulnerable to the effects of extreme heat.[27][28][29] During a heat wave in July 2023, heat-related EMS activation was 1.8 times higher for 23.6% of the 3089 U.S. counties which included areas with a higher CDC Social Vulnerability Index after accounting for monthly precipitation and maximum county temperature.[30] The CDC Social Vulnerability Index is based on four themes: 1) socioeconomic status, 2) household characteristics, 3) racial and ethnic minority status, and 4) housing type & transportation (Figure 12). The South, Midwest, and Southwest regions of the U.S. were where the CDC Social Vulnerability Index and Wisconsin Area Deprivation Index were increased the most.[31] The Area Deprivation Index also includes four domains which are used to rank neighborhoods by socioeconomic disadvantage: 1) income, 2) education, 3) employment, and 4) housing quality. In another study, social vulnerability and low resilience to extreme heat exposure was reported for nearly a quarter (23.8% ±0.4) of the U.S. population with 3 or more risk factors (e.g., housing quality, mode of transportation, financial hardship), 44.5% (±0.5) of those with 1-2 risk factors, and almost a third (31.7% ±0.5) of those with no risk factors based on the U.S. Census Bureau’s Community Resilience Estimates (CRE) for Heat.[32] The CRE for Heat was created to help identify areas with low resilience in the event of extreme heat occurrences.
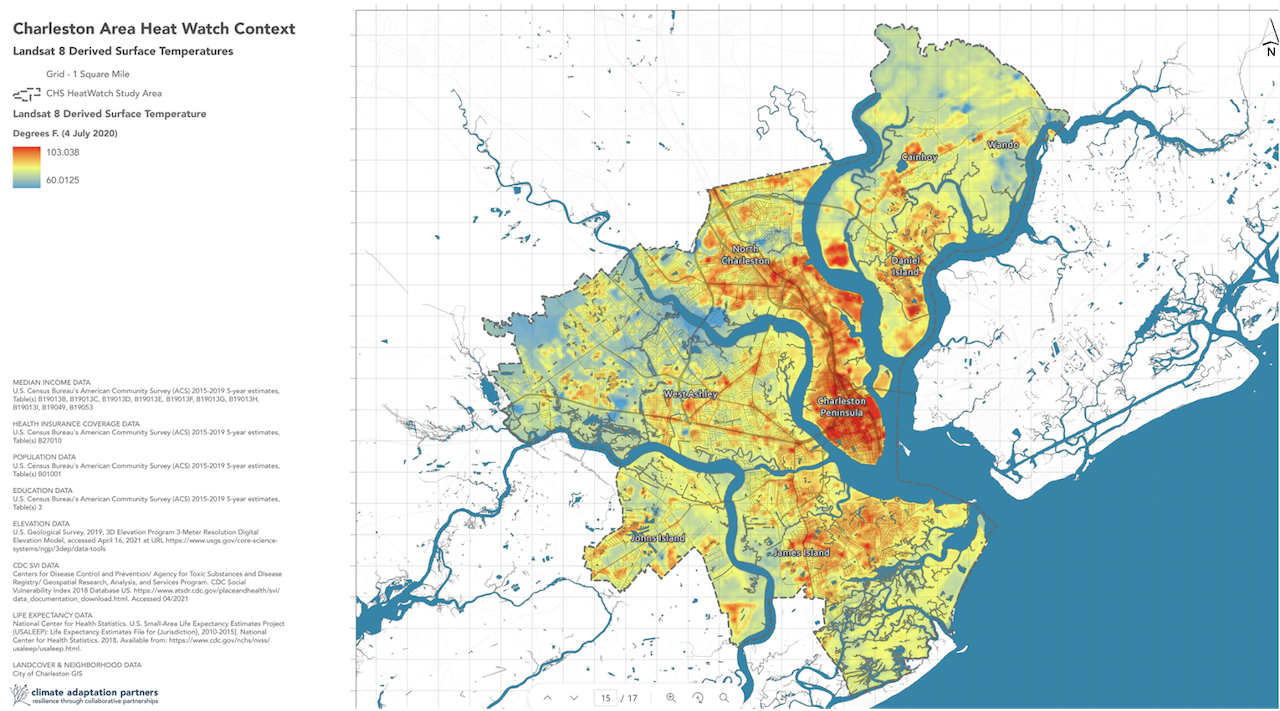
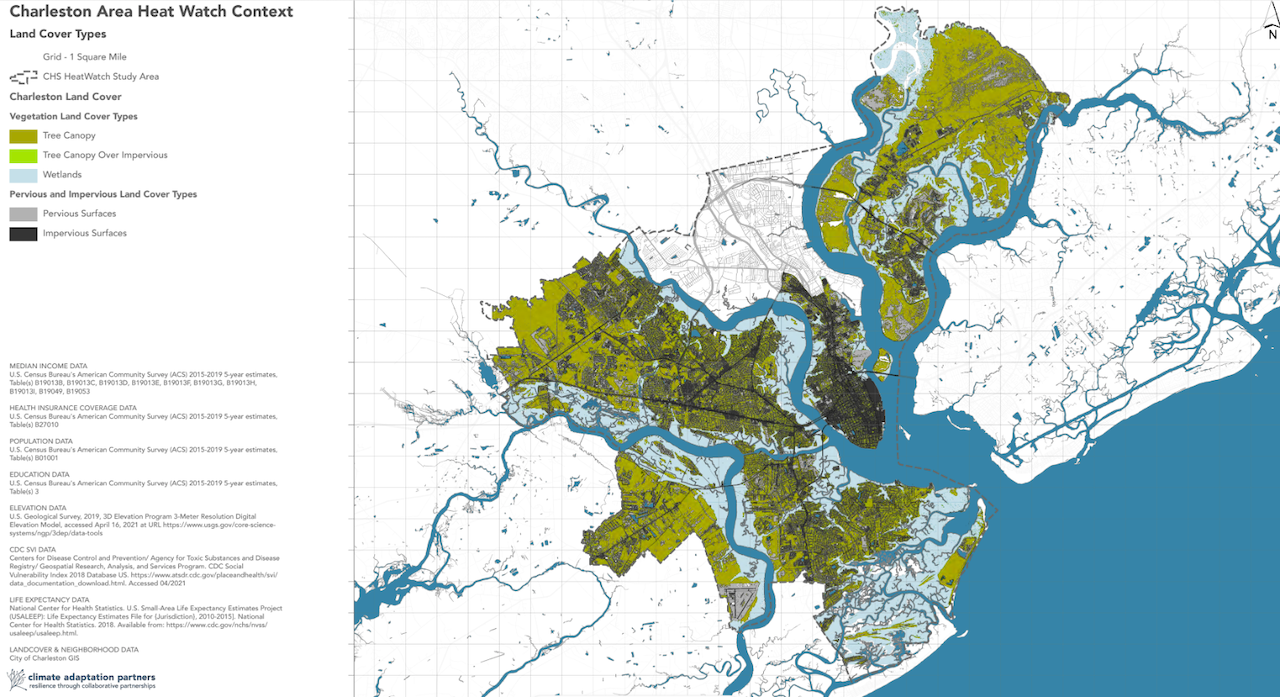
In Charleston, there are clearly differing heat islands with the darker oranges and reds on this map showing higher surface temperatures (Figure 13). These correlate with other challenges, such as greater areas of impervious surface and lower tree canopy cover (Figure 14).
Regional Differences
There are regional differences in the effects of heat on health; therefore, lessening the health effects of heat will require region-specific information. For example, although climate change is predicted to increase heat events in general, these events are likely to feel worse in areas of the U.S. with less experience in coping with extreme heat (e.g. the Northeast or Northwest). However, while here in the Lowcountry we already cope with extreme heat and the high humidity that makes the heat feel worse, our temperatures are substantially rising. Coupled with our higher humidity, our risks are also substantially increasing yet not frequently discussed. For residents who are used to higher temperatures and humidity, these increases in temperature could pose unexpected risks to health as we often pay less attention to the issues that are the most familiar.
Fortunately, a combination of adapting to the changing climate and coping strategies by the population seems to lessen the health effects in other similar hot/humid areas compared with hot/dry areas. Unfortunately, we do expect to see slightly higher numbers of deaths with more extreme heat days. This underscores the importance of addressing extreme heat in the Lowcountry.
Growing Population
Coastal South Carolina is one of the fastest growing areas in the U.S. The climate, history, culture, and beaches draw many new residents from northern states who are not accustomed to heat and humidity. Even long-time residents are noticing that it’s becoming warmer. With a growing population less accustomed to our climate and with changes in what locals have historically experienced, this Toolkit offers more context and readily available resources to help newer Lowcountry residents understand heat-related health risks, and to help everyone improve household level ability to cope with those risks, consider ways to mitigate extreme heat, and consider ways to adapt to our warming region.
To learn more:
- People at Risk of Extreme Heat
- About Heat and Your Health
- The Lowcountry Toolkit Glossary
Compounding Impacts of Extreme Heat and other Stressors
The effects of heat exposure on health compound with the addition of air pollution. “Hotter weather can increase concentrations of harmful air pollutants, including fine particles and ground-level ozone, by increasing emissions of pollutants and speeding up chemical reactions in the atmosphere. These pollutants are harmful to health, especially the very young and old, people with certain chronic health conditions, those without residential air conditioning, and those living where emissions from buildings and traffic are concentrated. Most of these factors that increase air pollution exposures and health impacts are more common among Black, Latino, and low-income households. Efforts to further reduce emissions and exposures of vulnerable populations can prevent or reduce climate-related air quality impacts.”[34]
“Climate change is causing earlier, longer, and possibly more intense plant pollen production seasons. Pollen from common tree species, ragweed, and grasses contribute to seasonal allergies and worsening of asthma symptoms. The burden of asthma is worse where communities have more exposure to household asthma triggers. Air conditioning and filtration can reduce indoor pollen exposure.”[35] “Attention to local tree cover density and species composition along with improved access to health care, evidence-based asthma management, and patient education can reduce pollen exposure, vulnerability, and future allergic illnesses.”[36] Moreover, those with more exposure to high levels of air pollution tend to also be people with low income or of minoritized groups. Finally, extreme heat in conjunction with high humidity and atmospheric instability can lead to pop-up thunderstorms and extreme rainfall, “rain bombs”, which can cause flash flooding in Charleston. “Compound extremes of lethal heat stress-heavy precipitation events (CHPEs) seriously threaten social and ecological sustainability…. A high percentage of heat stress is followed by heavy precipitation globally, probably driven by atmospheric conditions. Global average frequency and intensity of CHPEs are projected to increase in the future under high-emission scenarios.[37]
- [16] Matte, T., Lane, K., Tipaldo, J.F., Barnes, J., Knowlton, K., Torem, E., Anand, G., Yoon, L., Marcotullio, P., Balk, D., Constible, J., Elszasz, H., Ito, K., Jessel, S., Limaye, V., Parks, R., Rutigliano, M., Sorenson, C., & Yuan, A. (2024). NPCC4: Climate change and New York city’s health risk. Ann NY Acad Sci., 1539, 185–240. https://doi.org/10.1111/nyas.15115
- [17] NWS (April 25, 2025) Weather Related Fatality and Injury Statistics. https://www.weather.gov/hazstat
- [18] EPA (April 25, 2025) Know the Symptoms of Heat-Related Illnesses Infographic. https://www.epa.gov/emergencies-iaq/know-symptoms-heat-related-illnesses-infographic
- [19] Matte, T., Lane, K., Tipaldo, J.F., Barnes, J., Knowlton, K., Torem, E., Anand, G., Yoon, L., Marcotullio, P., Balk, D., Constible, J., Elszasz, H., Ito, K., Jessel, S., Limaye, V., Parks, R., Rutigliano, M., Sorenson, C., & Yuan, A. (2024). NPCC4: Climate change and New York city’s health risk. Ann NY Acad Sci., 1539, 185–240. https://doi.org/10.1111/nyas.15115
- [20] USGCRP (2018) Fourth National Climate Assessment Chapter 14: Human Health. Figure 14.2. Vulnerable Populations. https://nca2018.globalchange.gov/chapter/14/
- [21] McGeehin, M. A. and M. Mirabelli (2001). “The potential impacts of climate variability and change on temperature-related morbidity and mortality in the United States.” Environ Health Perspect 109 Suppl 2(Suppl 2): 185-189.
- [22] McGeehin, M. A. and M. Mirabelli (2001). “The potential impacts of climate variability and change on temperature-related morbidity and mortality in the United States.” Environ Health Perspect 109 Suppl 2(Suppl 2): 185-189.
- [23] Ebi, K. L., A. Capon, P. Berry, C. Broderick, R. de Dear, G. Havenith, Y. Honda, R. S. Kovats, W. Ma, A. Malik, N. B. Morris, L. Nybo, S. I. Seneviratne, J. Vanos and O. Jay (2021). “Hot weather and heat extremes: health risks.” Lancet 398(10301): 698-708.
- [24] Darrow, Huang, Warren et al. (2024) Preterm and Early-term delivery after heat waves in 50 US metropolitan areas.https://jamanetwork.com/journals/jamanetworkopen/fullarticle/2819253#:~:text=Heat%20waves%20were%20positively%20associated,more%20acute%204%2Dday%20window.
- [25] Manuck TA. Racial and ethnic differences in preterm birth: A complex, multifactorial problem. Semin Perinatol. 2017 Dec;41(8):511-518. doi: 10.1053/j.semperi.2017.08.010. Epub 2017 Sep 21. PMID: 28941962; PMCID: PMC6381592.
- [26] Harlan, S. L., A. J. Brazel, L. Prashad, W. L. Stefanov and L. Larsen (2006). “Neighborhood microclimates and vulnerability to heat stress.” Soc Sci Med 63(11): 2847-2863.
- [27] CDC. The National Institute for Occupational Safety and Health (NIOSH). (2020). “Heat Stress.” Retrieved 2024, June 2, from https://www.cdc.gov/niosh/topics/heatstress/default.html.
- [28] The National Institute for Occupational Safety and Health [NIOSH] 2020
- [29] Ebi, K. L., A. Capon, P. Berry, C. Broderick, R. de Dear, G. Havenith, Y. Honda, R. S. Kovats, W. Ma, A. Malik, N. B. Morris, L. Nybo, S. I. Seneviratne, J. Vanos and O. Jay (2021). “Hot weather and heat extremes: health risks.” Lancet 398(10301): 698-708.
- [30] Ramesh, T., G. D. Wozniak and H. Yu (2024). “County-Level Disparities in Heat-Related Emergencies.” JAMA Netw Open 7(3): e242845.
- [31] Ramesh, T., G. D. Wozniak and H. Yu (2024). “County-Level Disparities in Heat-Related Emergencies.” JAMA Netw Open 7(3): e242845.
- [32] Gurrentz, B. S., R.C. (2023). “New Community Resilience Estimates For Heat Identify Areas Socially Vulnerable to Extreme Heat.” from https://www.census.gov/library/stories/2023/07/almost-a-quarter-of-population-vulnerable-to-rising-heat.html.
- [33] CDC (April 25, 2025). Social Vulnerability Index | Place and Health – Geospatial Research, Analysis, and Services Program (GRASP) | ATSDR: https://www.atsdr.cdc.gov/place-health/php/svi/index.html
- [34] Matte, T., Lane, K., Tipaldo, J.F., Barnes, J., Knowlton, K., Torem, E., Anand, G., Yoon, L., Marcotullio, P., Balk, D., Constible, J., Elszasz, H., Ito, K., Jessel, S., Limaye, V., Parks, R., Rutigliano, M., Sorenson, C., & Yuan, A. (2024). NPCC4: Climate change and New York city’s health risk. Ann NY Acad Sci., 1539, 185–240. https://doi.org/10.1111/nyas.15115
- [35] Matte, T., Lane, K., Tipaldo, J.F., Barnes, J., Knowlton, K., Torem, E., Anand, G., Yoon, L., Marcotullio, P., Balk, D., Constible, J., Elszasz, H., Ito, K., Jessel, S., Limaye, V., Parks, R., Rutigliano, M., Sorenson, C., & Yuan, A. (2024). NPCC4: Climate change and New York city’s health risk. Ann NY Acad Sci., 1539, 185–240. https://doi.org/10.1111/nyas.15115
- [36] Matte, T., Lane, K., Tipaldo, J.F., Barnes, J., Knowlton, K., Torem, E., Anand, G., Yoon, L., Marcotullio, P., Balk, D., Constible, J., Elszasz, H., Ito, K., Jessel, S., Limaye, V., Parks, R., Rutigliano, M., Sorenson, C., & Yuan, A. (2024). NPCC4: Climate change and New York city’s health risk. Ann NY Acad Sci., 1539, 185–240. https://doi.org/10.1111/nyas.15115
- [37] Zhou et al (2024) Global increase in future compound heat street-heavy precipitation hazards and associated socio-ecosystem risks: https://doi.org/10.1038/s41612-024-00579-4)